대기 중 이산화탄소의 동향-Trends in Atmospheric Carbon Dioxide
페이지 정보

본문

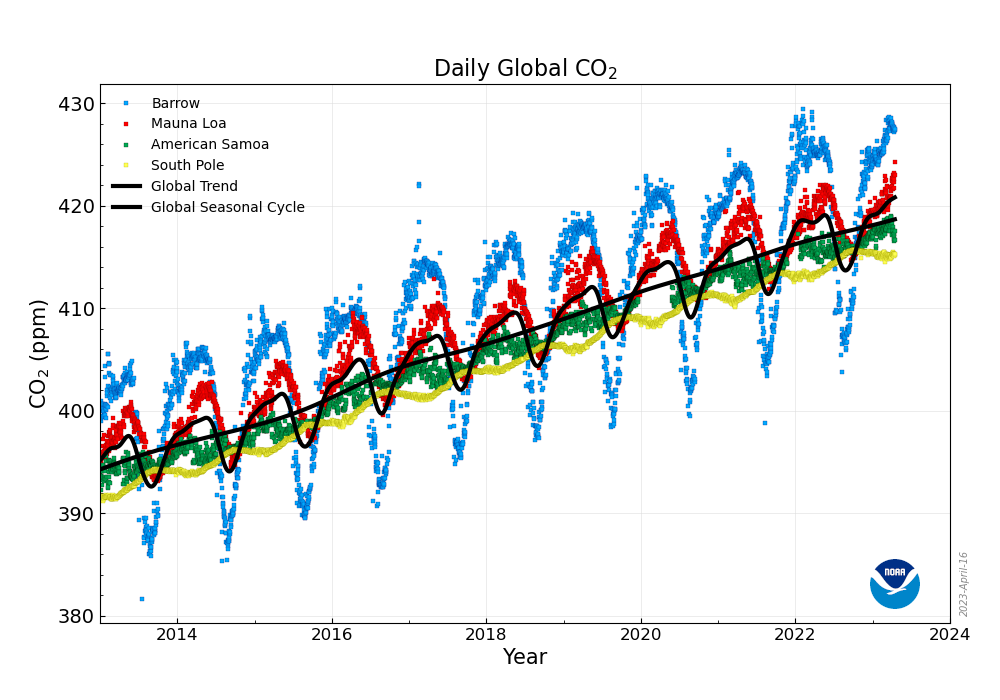
The figure shows daily averaged CO2 from four GML Atmospheric Baseline observatories; Barrow, Alaska (in blue), Mauna Loa, Hawaii (in red), American Samoa (in green), and South Pole, Antarctica (in yellow). The thick black lines represent the average of the smoothed seasonal curves and the smoothed, de-seasonalized curves for each of the records. These lines are a very good estimate of the global average levels of CO2.
관련링크
- 이전글CO2 및 온실가스 배출-CO₂ and Greenhouse Gas Emissions 23.04.17
- 다음글탄소 중립에 대한 설명 - Explaining Carbon Neutrality 23.02.27

